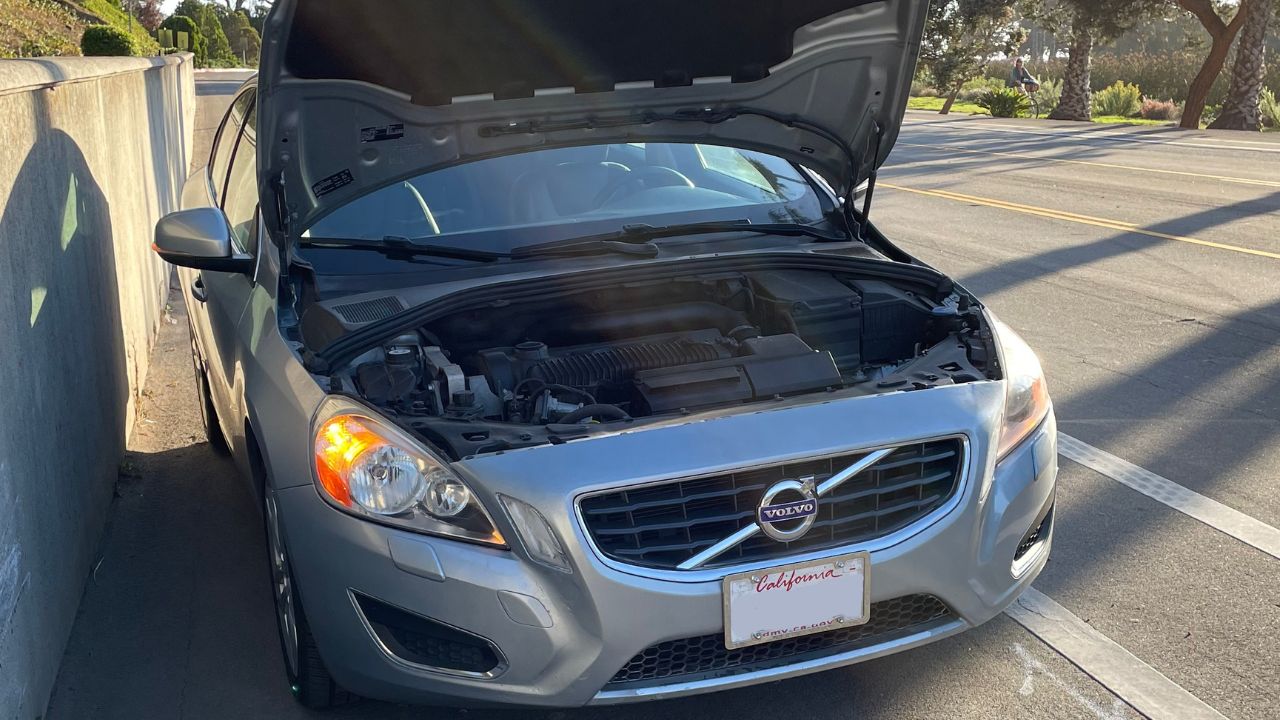
Your car’s greatest enemy is not reckless driving or skipped oil changes. It is geography, apparently. Where you live quietly determines how fast your vehicle ages, what breaks first, and how often your mechanic greets you with bad news.
A recent report by Greasemonkey takes a deep dive into which parts of the United States are hardest on cars, and the findings read like a weather forecast for mechanical misery. From icy highways to sun-scorched parking lots, the environment plays a bigger role in vehicle health than many drivers realize.
The Rust Belt: Where Winter Attacks
Let’s start in the north, where winter is not just a season but a full-blown assault on metal. States like Michigan, New York, and Ohio sit firmly in what drivers call the rust belt. Snowfall alone would be manageable, but the real villain is road salt.

It keeps highways safe, but it quietly eats away at your car’s underbody. Brake lines, suspension components, and even the frame itself can fall victim to corrosion. Rust does not just look ugly. It compromises structural integrity, and once it sets in, reversing the damage is almost impossible.
Cold weather adds another layer of trouble. Batteries lose strength in freezing temperatures, engine oil thickens, and every morning start becomes a small act of mechanical bravery. Over time, that repeated stress chips away at reliability.
Head south, and the story changes. The sun takes over as the primary antagonist. In states like Arizona and Nevada, the heat is relentless.
Paint fades, dashboards crack, and rubber seals dry out like forgotten fruit. While your car might avoid rust, it pays the price in cosmetic aging. Interiors become brittle, and air conditioning systems work overtime just to keep things bearable.
Coastal Threats and Road Quality
Then there is the coastal reality. Places like Florida, Louisiana, and parts of Texas bring a different kind of threat. Moisture hangs in the air, and storms are never too far away. Flooding is the silent saboteur here.

A car can look perfectly fine after being exposed to water, only for electrical issues to surface weeks or months later. Corrosion creeps into wiring and connectors, creating problems that are just as expensive as they are frustrating to diagnose.
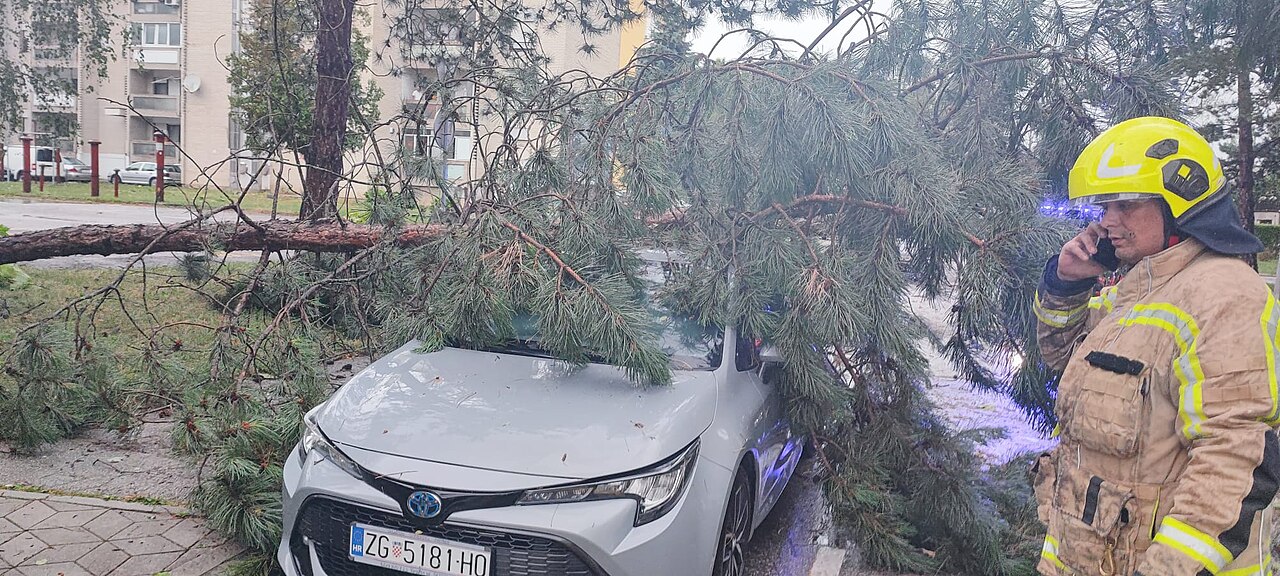
Road quality also deserves its moment in the spotlight. Some states combine harsh weather with less-than-perfect infrastructure. Potholes, cracked asphalt, and uneven surfaces punish tires and suspension systems daily. One bad hit can throw off alignment or damage a wheel, turning an ordinary commute into an unexpected repair bill.
The real newsflash from the Greasemonkey report is that no single region has a monopoly on damage. Instead, each climate has its own specialty. Cold regions attack your car’s structure. Hot regions accelerate aging and wear. Wet regions introduce hidden, long-term issues that can surface without warning.
The Geography of Car Ownerships
What the study succeeded in doing is reminding everyone that the car ownership experience requires more than knowing how to drive and care for your car; it’s as much about where you drive. Why? A well-maintained vehicle in a harsh climate may still age faster than a neglected one in milder conditions. Geography quietly tips the scales.
For readers outside the United States, the lesson still hits home. Coastal cities with heavy rainfall and humidity share similarities with flood-prone American states. Hot urban centers mirror desert conditions. Even without snow, environmental stress never takes a day off.
So, the next time you think about vehicle longevity, look beyond mileage and service records. Consider the air, the roads, and the weather patterns surrounding your daily drive. According to Greasemonkey’s findings, your postcode might be doing more damage than your driving habits ever could.
Top 10 States that Cause the Most Damage to Cars, According to GreaseMonkey
| State | Hail | Snow Days | Avg. Morning Humidity | Avg. Afternoon Humidity | Total Sunshine Hours | FEMA Natural Disasters | Avg. Yearly Natural Disasters | FEMA Declared Emergency Floods | Avg. Yearly Floods | Road Conditions Percentage of Acceptable Miles Overall | Auto Accident Fatality Rates per 100k | Coastal State? | Salt Belt State? | Final Damage Score |
| Texas | 1,366 | 1.3 | 82% | 49% | 2,850 | 372 | 5.2 | 360 | 5.7 | 76.78% | 18.3 | Yes | No | 658.03 |
| Mississippi | 148 | 0.6 | 91% | 54% | 2,720 | 83 | 1.2 | 68 | 1.1 | 70.15% | 32.8 | Yes | No | 629.27 |
| New York | 75 | 66.4 | 82% | 61% | 2,120 | 104 | 1.4 | 161 | 2.6 | 75.43% | 11.9 | Yes | Yes | 627.21 |
| Delaware | 5 | 11.8 | 79% | 54% | N/A* | 19 | 0.3 | 3 | 0 | 84.22% | 30.3 | Yes | Yes | 607.53 |
| Oklahoma | 525 | 5.6 | 79% | 48% | 3,089 | 224 | 3.1 | 207 | 3.3 | 73.12% | 21.1 | No | No | 602.40 |
| Missouri | 363 | 11.5 | 82% | 53% | 2,690 | 70 | 1 | 282 | 4.5 | 75.52% | 18 | No | Yes | 591.76 |
| Minnesota | 428 | 37.3 | 78% | 55% | 2,711 | 74 | 1 | 471 | 7.5 | 90.54% | 7 | No | Yes | 576.82 |
| Kansas | 637 | 10 | 80% | 50% | 2,922 | 81 | 1.1 | 178 | 2.8 | 96.19% | 15.7 | No | Yes | 573.99 |
| West Virginia | 48 | 37.7 | 83% | 59% | N/A* | 79 | 1.1 | 238 | 3.8 | 91.75% | 17.2 | No | Yes | 566.23 |
| North Dakota | 169 | 45.2 | 80% | 51% | 2,738 | 68 | 0.9 | 481 | 7.6 | 93.33% | 10 | No | Yes | 566.18 |