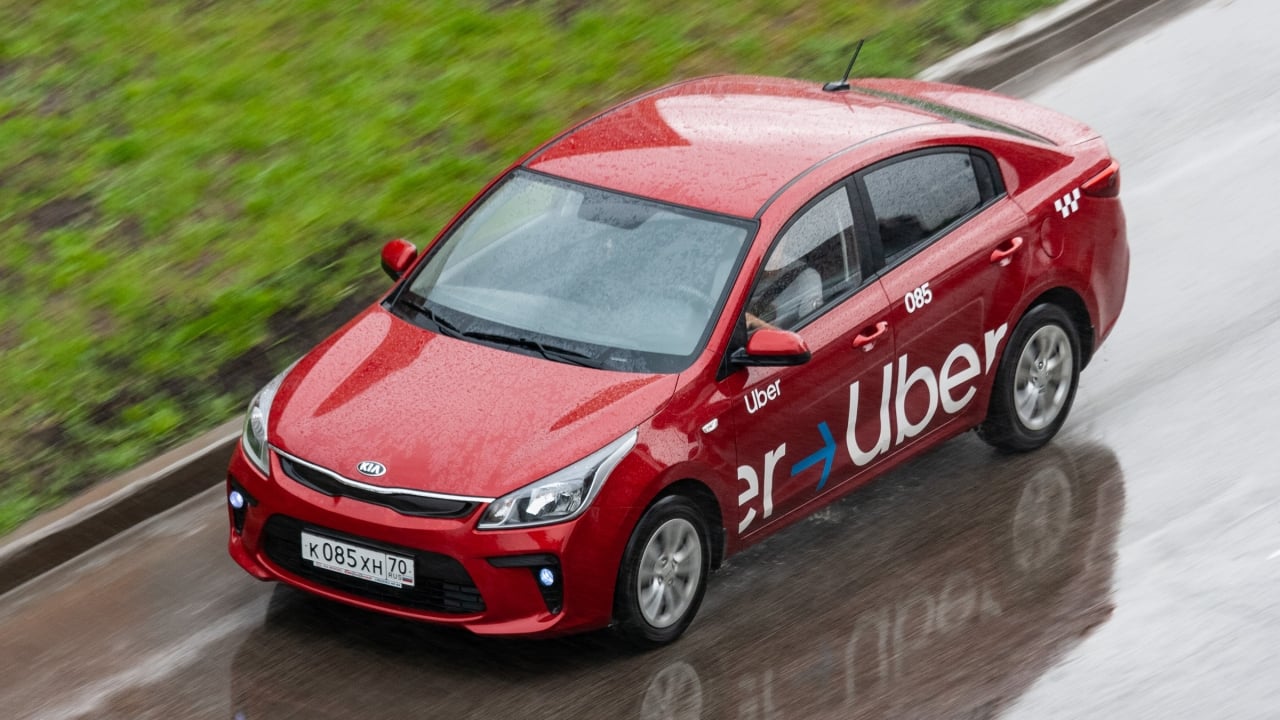
Rideshare fares can feel unpredictable, but a new Gridwise analysis suggests one major cost is hiding in plain sight. According to the report, insurance accounts for about 21% of the average Uber or Lyft fare.
That means roughly $1 out of every $5 paid by a rider is allocated to insurance before the driver and platform receive their respective shares. By comparison, Gridwise estimates that driver base pay represents 53.3% of the fare, while platform fees account for 14.9%.
The report also found that rideshare insurance expenses have recently started to fall in some parts of the United States. Lower costs have not necessarily translated into cheaper rides or substantially higher driver pay, however.
Gridwise’s figures are based on platform-labeled insurance expenses within individual gig transactions rather than audited insurer payouts. Even with that limitation, the findings show how heavily insurance influences the economics of app-based transportation.
Insurance Takes a Larger Share Than Platform Fees

Gridwise found that insurance consumes a larger portion of the average rideshare fare than the platform fee itself. The remaining amount is divided between driver base pay, incentives, bonuses, and other forms of compensation.
The scale of the insurance charge helps explain why customer prices can remain high even when drivers feel they are receiving a relatively small share. Rideshare companies must maintain substantial commercial coverage because their vehicles are carrying paying passengers and operating frequently in dense urban areas.
Delivery work carries a smaller insurance expense because trips are generally shorter and do not involve passengers. Uber Eats insurance costs fell 8.3% between the first quarter of 2025 and the first quarter of 2026, according to Gridwise.
Costs Are Falling, but Not Everywhere
Average insurance expense per ride declined 5.1% for Uber and 5.5% for Lyft over the same year-long period. The similar movement between the companies suggests that wider insurance-market conditions may be playing a larger role than platform-specific changes.
Regional differences remain significant. Rideshare insurance expenses fell 20.6% in the West and 6.3% in the South, while increasing 15.8% in the Southwest, 7% on the East Coast, and 3.5% in the Midwest.
Delivery insurance followed a different pattern. Costs fell sharply in the Southwest, South, West, and Midwest, while the East Coast recorded a 3% increase.
California’s Rule Change Had a Major Impact
The sharp decline in western insurance expenses appears closely linked to California’s SB 371, which took effect on January 1, 2026. The law reduced required uninsured and underinsured motorist coverage from $1 million to $60,000 per person and $300,000 per incident.
Liability coverage requirements remained at $1 million. The timing of the change closely matched a major reduction in insurance expense between the final quarter of 2025 and the first quarter of 2026.
California lawmakers indicated that savings should benefit drivers and riders. Gridwise’s early data suggests the financial gains have not yet clearly reached either group.
Lower Insurance Costs Did Not Mean Cheaper Rides

Although western insurance expenses dropped 20.6%, customer prices increased 3.4% during the same period. Platform fees rose 29.1%, while driver base pay increased only 1.2%.
Those figures do not prove that platforms kept every dollar of savings. Some of the money may have been directed toward promotions, reserves, other operating expenses, or selective price reductions that do not appear clearly in regional averages.
The contrast still raises questions about where insurance savings ultimately go. Riders may reasonably expect lower fares, while drivers may expect a larger share when one of the platform’s major expenses declines.
Neighborhood-Level Differences Can Be Severe
Gridwise also found substantial differences within individual cities. In Chicago’s 20 lowest-income ZIP codes, insurance expense per trip was 37.6% higher than in the rest of the metropolitan area, despite similar average trip distances.
Insurance represented 18.3% of customer pricing in those neighborhoods, compared with 12.5% elsewhere in the city. That suggests factors such as local claims history, traffic risk, crime, and insurer pricing models may influence costs as much as mileage.
These differences could affect both rider affordability and driver earnings in lower-income communities. A larger insurance charge leaves less room for driver pay unless customer prices also rise.
The True Cost Is Still Difficult to Measure
Gridwise’s report offers a useful look at how platforms divide a fare, but its insurance figure should not be treated as the exact cost of covering each individual trip. The labeled expense may include broader risk estimates, reserves, administrative costs, and other internal calculations.
Even so, a charge equal to roughly one-fifth of the average fare is too large to ignore. Insurance has become one of the biggest forces shaping rideshare pricing, driver compensation, and platform profitability.
Do you think lower insurance expenses should automatically lead to cheaper Uber and Lyft fares, or should more of the savings go directly to drivers? Let us know in the comments whether the insurance share of your rideshare bill is higher than you expected.