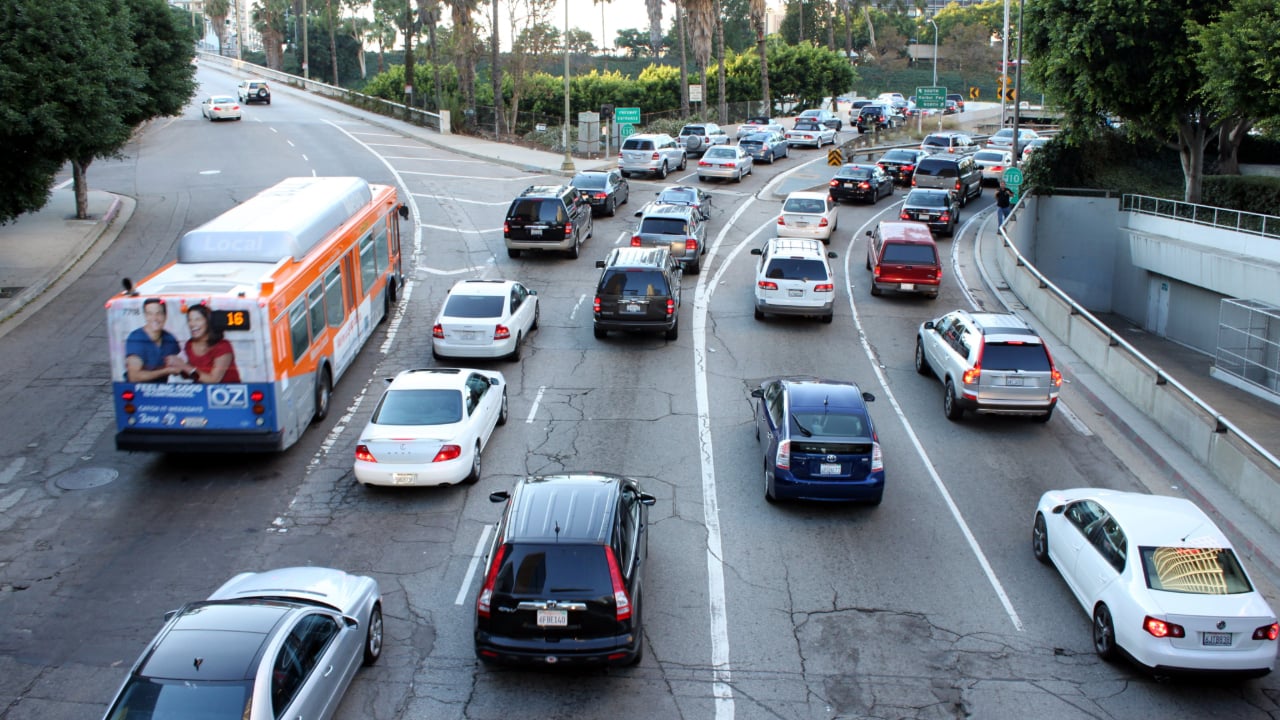
California accounts for six of the 10 major U.S. cities with the highest accident rates, according to a new study. Some of the state’s biggest cities rank near the top, including San Diego, Los Angeles, and San Francisco.
The LendingTree study, updated October 19, examined insurance quote data from the 50 largest U.S. cities. Researchers compared reported accidents per 1,000 drivers.
California didn’t take first place. Raleigh, North Carolina, took that distinction, recording 29.1 accidents per 1,000 drivers. San Diego was close behind at 28.2.
The findings also reveal which generations and vehicle brands have the highest accident rates. Younger drivers lead the generational rankings, while pickup trucks and electric vehicles appear near the top of the brand list.
California Takes Six Spots
San Diego ranks second nationally, with 28.2 accidents per 1,000 drivers. Los Angeles and San Francisco tie for third at 26.9, while Sacramento ranks sixth with 25.6.
Long Beach ranks eighth at 22.7, followed by San Jose in ninth place at 22.3.
All six California cities exceed the national rate of 17.9 accidents per 1,000 drivers.
The state also has several cities just outside the top 10. Bakersfield ranks 11th, Fresno 13th, and Oakland 15th.
LendingTree auto insurance expert Lindsay Bishop says heavy traffic may help explain California’s showing.
Drivers in major California cities often deal with crowded freeways, busy intersections, and frequent lane changes. Each interaction between vehicles creates another chance for a collision.
However, the results don’t necessarily mean California drivers are less skilled. Traffic conditions, time spent driving, road design, and driver behavior can all affect accident rates.
Gen Z Leads Rankings
The study also compared accident rates across generations, and Gen Z drivers ranked highest.
Drivers ages 18 to 28 recorded 33.1 accidents per 1,000 drivers, more than double the rates for millennials and Gen X.
Millennials had 14.8 accidents per 1,000 drivers, while Gen X had 14.9.
Baby boomers, ages 61 to 79, had the second-highest accident rate at 18.0 per 1,000 drivers.
Bishop points to driving experience as one reason for the gap. Younger drivers have had less time to recognize dangerous road conditions and respond to unexpected situations.
She also says younger drivers are more likely to engage in risky behavior, including speeding.
The numbers could have financial consequences. Insurance companies consider accident risk when setting premiums, which helps explain why younger drivers often pay more for coverage.
Ram Drivers Rank First
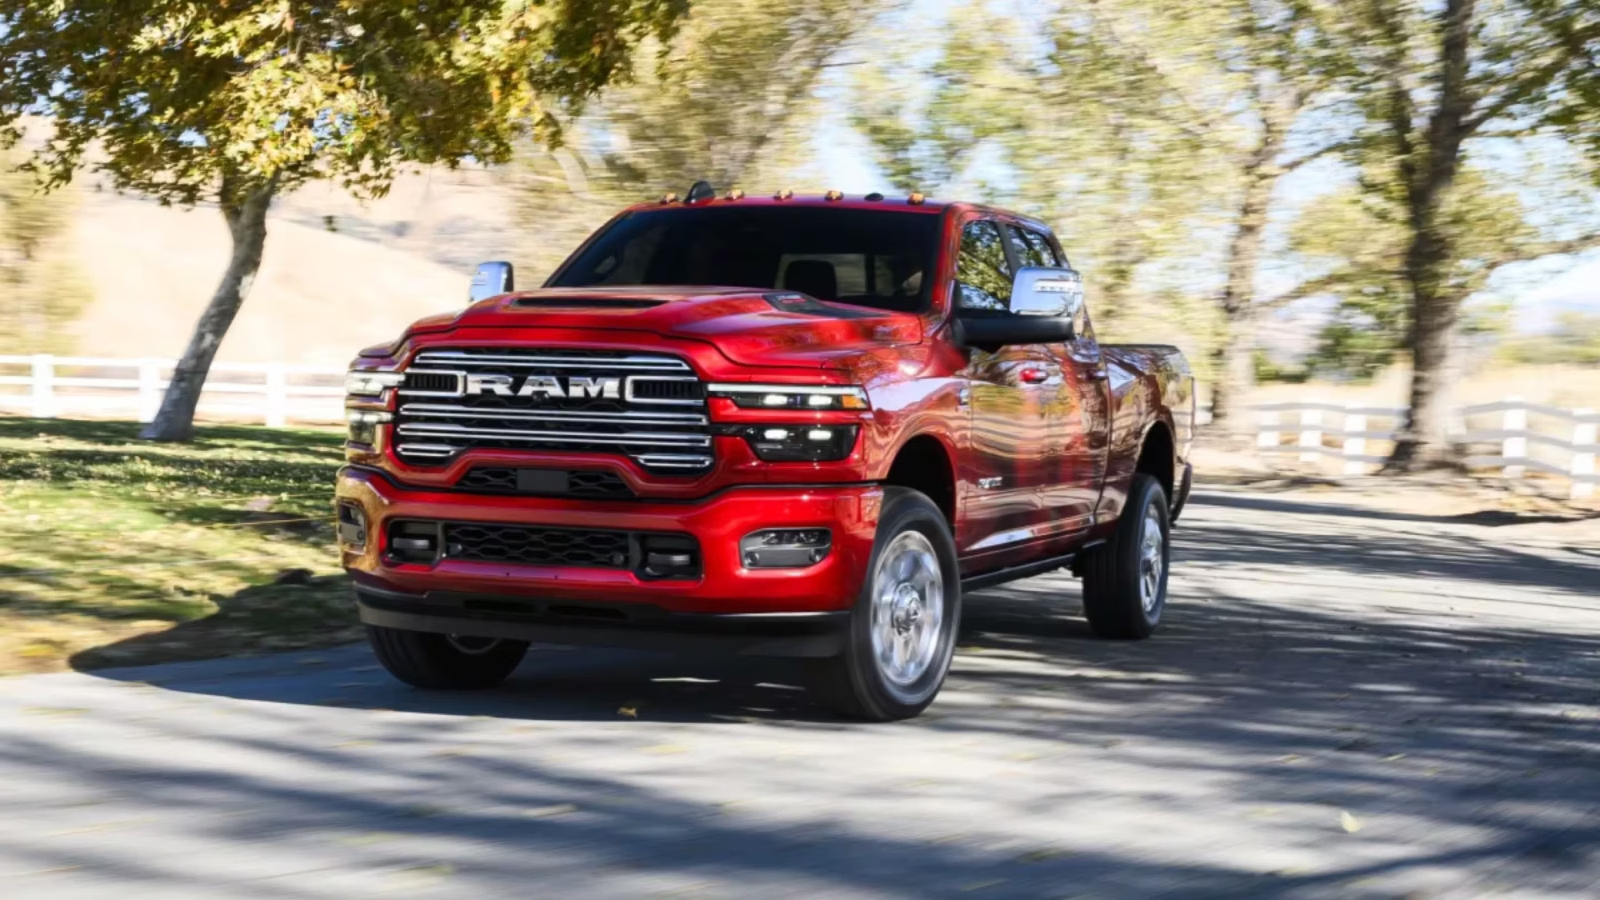
The study found another interesting trend when researchers examined accident rates by vehicle brand.
Ram drivers had the highest rate at 25.9 accidents per 1,000 drivers. Tesla followed at 25.0, while Subaru ranked third at 23.4.
Lexus and Toyota rounded out the top five, with rates of 20.8 and 20.4.
At the opposite end, Pontiac had the lowest rate among the 30 brands examined, at just 9.0 accidents per 1,000 drivers.
Chrysler followed at 11.4, while Cadillac came in at 12.1.
Bishop cautions that the brand rankings don’t prove certain vehicles are inherently more dangerous. Driver age, experience, driving habits, and location may influence the results.
Deadliest Cities Look Different
The cities with the highest accident rates aren’t necessarily the places with the most deadly crashes.
LendingTree separately examined 2024 federal crash records and found that Memphis, Tennessee, had the highest fatal crash rate among major U.S. cities.
Memphis recorded 27.7 fatal crashes per 100,000 residents, more than twice the national rate of 10.7.
Tucson, Arizona, ranked second at 24.0, followed by Albuquerque, New Mexico, at 19.1.
California’s cities performed considerably better in that category. San Diego recorded 7.3 fatal crashes per 100,000 residents, while Los Angeles had 7.6 and San Francisco had 5.0.
This distinction matters because an area with frequent accidents doesn’t always have the deadliest roads.
Speed, road design, and access to emergency medical care can affect whether a collision becomes fatal.
What The Numbers Mean
LendingTree based its accident rankings on QuoteWizard insurance quote data collected from August 1, 2025, through July 31, 2026.
That means the figures reflect accidents reported in the insurance quote data, rather than a complete count of every crash recorded by police.
The fatal crash rankings used a different source: the National Highway Traffic Safety Administration’s Fatality Analysis Reporting System for 2024.
LendingTree recommends reducing speed, leaving more room between vehicles, and avoiding heavily congested driving periods when possible.
Drivers can also compare insurance quotes and look into safe-driving discount programs to help control their costs.